http://www.britainfromabove.org.uk/image/wpw032442
View of Brynmawr, oblique aerial view. 5”x4” black and white glass plate negative.
Thursday, July 31, 2014
Parallel coordinate graph
http://www.intechopen.com/books/biosensors/symbolic-modelling-of-dynamic-human-motions
Parallel Coordinate Plot: providing visualisation of all selected features, for all participants (p1-p10) —covering here, 3837 data frames.
Lorenz curve
http://www.worldbank.org/depweb/english/beyond/global/chapter5.html
To measure income inequality in a country and compare this phenomenon among countries more accurately, economists use Lorenz curves and Gini indexes. A Lorenz curve plots the cumulative percentages of total income received against the cumulative percentages of recipients, starting with the poorest individual or household
Isopleth
http://www.stonelions.com/DuPont.htm
isopleth map depicting 1992 annual average dioxin concentrations in the vicinity of the Dupont plan
Isopach
http://www.searchanddiscovery.com/documents/abstracts/2005hedberg_vail/abstracts/extended/yurewicz/images/fig02.htm
Isopach of the "gas column" (based on continuous gas shows) above the Rollins Sandstone
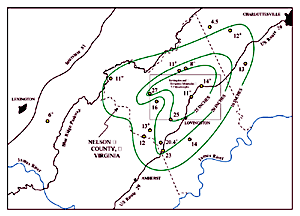
Isohyet
http://pubs.usgs.gov/of/1999/ofr-99-0518/ofr-99-0518.html
Isohyets for total rainfall from Hurricane Camille, August 19 and 20, 1969 in Nelson County, Virginia. Rainfall measurements plotted are in inches and are taken from Camp and Miller (1970). Plus signs indicate that rain gauges overflowed and only minimum rainfall is known.
Subscribe to:
Posts (Atom)