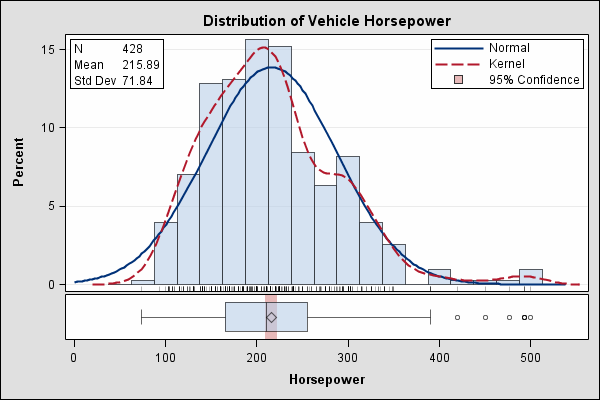
This sample uses the Graph Template Language (GTL) to produce a distribution plot. It uses a two-row lattice layout. The upper cell contains a histogram with normal and kernel density curves, a legend, and a table. The lower cell contains a horizontal box plot and a band plot.
No comments:
Post a Comment