http://blogs.worldbank.org/sustainablecities/george-washington-and-land-readjustment
Satellite image by Google Earth of Washington DC
Thursday, July 31, 2014
Continuously Variable Proportional Circle Map
http://go.owu.edu/~jbkrygie/krygier_html/geog_353/geog_353_lo/geog_353_lo11.html
Graduated symbol maps
- also called proportional point symbol mapping
- variable point symbol mapping
- ArcGIS: Graduated (classed) vs Proportional (unclassed) symbol maps
Unstandardized Chroleth map
http://www.ij-healthgeographics.com/content/3/1/18/figure/F6
Choropleth map of Bayesian smoothed prevalences in Lower Saxony. Choropleth map of the empirical Bayesian smoothed period prevalences from 43 regions in Lower Saxony. Cut points of the grey scale shading are the 5%, 50% and 95% quantiles of the empirical distribution.
Bivariate Choropleth map
http://www.geo.unizh.ch/~annal/Choropleth%20maps.html
The project focused on representing geographical relationship on choropleth maps. The results of the usability test, comparing effectiveness of bivariate and univariate maps, verify opinion about poor readability of two-variable choropleth maps. Two-variable maps can be properly understood by the readers and hence can serve as an effective tool for a visual exploration of geographical relationship.
Unclassed choropleth
http://go.owu.edu/~jbkrygie/krygier_html/geog_353/geog_353_lo/geog_353_lo07.html
"Unclassed" choropleth maps: the number of categories is equal to the number of data values
Each value has a unique symbol
- ex) range of values from 0 to 100 represented with 0% to 100% black
Political Map
http://www.worldatlas.com/aatlas/infopage/political.htm
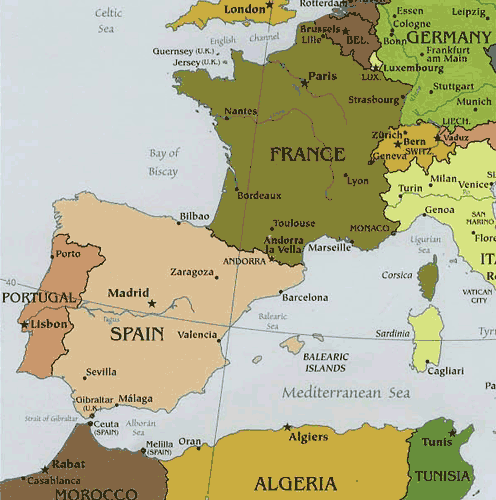
Political maps are designed to show governmental boundaries of countries, states, and counties, the location of major cities, and they usually include significant bodies of water. Like the sample above, bright colors are often used to help the user find the borders
Black and White Aerial photo
http://www.britainfromabove.org.uk/image/wpw032442
View of Brynmawr, oblique aerial view. 5”x4” black and white glass plate negative.
Parallel coordinate graph
http://www.intechopen.com/books/biosensors/symbolic-modelling-of-dynamic-human-motions
Parallel Coordinate Plot: providing visualisation of all selected features, for all participants (p1-p10) —covering here, 3837 data frames.
Lorenz curve
http://www.worldbank.org/depweb/english/beyond/global/chapter5.html
To measure income inequality in a country and compare this phenomenon among countries more accurately, economists use Lorenz curves and Gini indexes. A Lorenz curve plots the cumulative percentages of total income received against the cumulative percentages of recipients, starting with the poorest individual or household
Isopleth
http://www.stonelions.com/DuPont.htm
isopleth map depicting 1992 annual average dioxin concentrations in the vicinity of the Dupont plan
Isopach
http://www.searchanddiscovery.com/documents/abstracts/2005hedberg_vail/abstracts/extended/yurewicz/images/fig02.htm
Isopach of the "gas column" (based on continuous gas shows) above the Rollins Sandstone
Isohyet
http://pubs.usgs.gov/of/1999/ofr-99-0518/ofr-99-0518.html
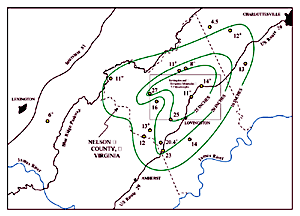
Isohyets for total rainfall from Hurricane Camille, August 19 and 20, 1969 in Nelson County, Virginia. Rainfall measurements plotted are in inches and are taken from Camp and Miller (1970). Plus signs indicate that rain gauges overflowed and only minimum rainfall is known.
Isobar
https://www.ametsoc.org/amsedu/dstreme/extras/usr_guide/Pressure.html
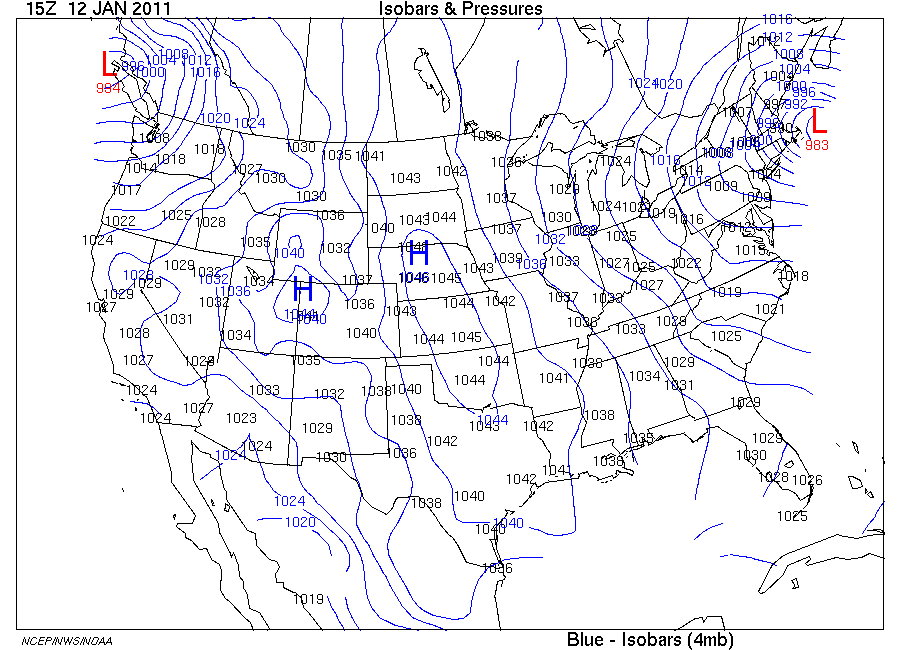
Isobars (map on right) are blue lines which connect equal pressure values based on the set from 1000 mb with an interval of 4 mb above or below that. Isobar values are labeled in blue within the isobar lines that are contained in the map area. Additionally, centers of locally highest and lowest pressures are marked by a blue H and red L, respectively.
Infrared Aerial
http://www.camdencountylandtrust.org/Grover%20Island.htm
COLOR INFRARED AERIAL PHOTOGRAPH OF GROVER ISLAND, NORTH AT TOP. (Island is about 1.4 miles across, east-west.)
Doppler radar
http://www.srh.noaa.gov/tae/?n=climate_2005review
Doppler radar image of Hurricane Dennis as it made landfall between Navarre and Gulf Breeze, FL, on the afternoon of July 10, 2005.
Scatter plots
http://www.nature.com/nprot/journal/v7/n3/fig_tab/nprot.2012.005_F6.html
Scatter plot of cluster expression between two biological replicates
Climograph
http://www.uleth.ca/vft/waterton2/Climate.htm
A climograph created from temperature and precipitation measurements
at Waterton Park Gate (Environment Canada, 2005). A
monthly average of the data from 1996-2004 was used to create the graph in
Excel.
Subscribe to:
Posts (Atom)